Clinical Medicine Leads Stanford–Elsevier’s Top-Cited Scientist Rankings
The U.S. leads clinical medicine by total researchers, while Switzerland and Denmark rank highest per resident in the 2026 Stanford–Elsevier list.
Programming languages, frameworks, and development tools
Found 165 articles
The U.S. leads clinical medicine by total researchers, while Switzerland and Denmark rank highest per resident in the 2026 Stanford–Elsevier list.
Follow MICE’s chained conditional models in R, generate ten completed datasets, and compare the results with the mice package.
New R packages help analysts address incomplete measurements, variable treatment effects and climate data, with workflows that make assumptions and data coverage more visible.
La baisse du prix des jetons ne garantit pas des économies : les erreurs, les reprises humaines et la dérive du modèle déterminent le coût réel.
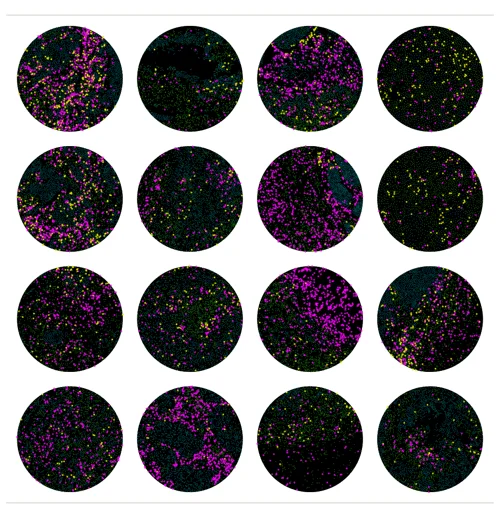
sccomp models cell counts across repeated biopsies and nested tissue regions, accounting for patient-level variation, outliers, and changes in cell composition.
AtlasCore, PolyFucked, and Magnetic Team package fake prediction markets with crypto payments, AI-assisted outreach, and controls that block withdrawals.
A Lucid Motors platform used one Argo CD hub for 34 clusters, with configuration contracts, rendered diffs and safeguards to manage scale.
FAIR principles make WASH data easier to find and reuse, while CARE principles center community rights, control, and benefit.
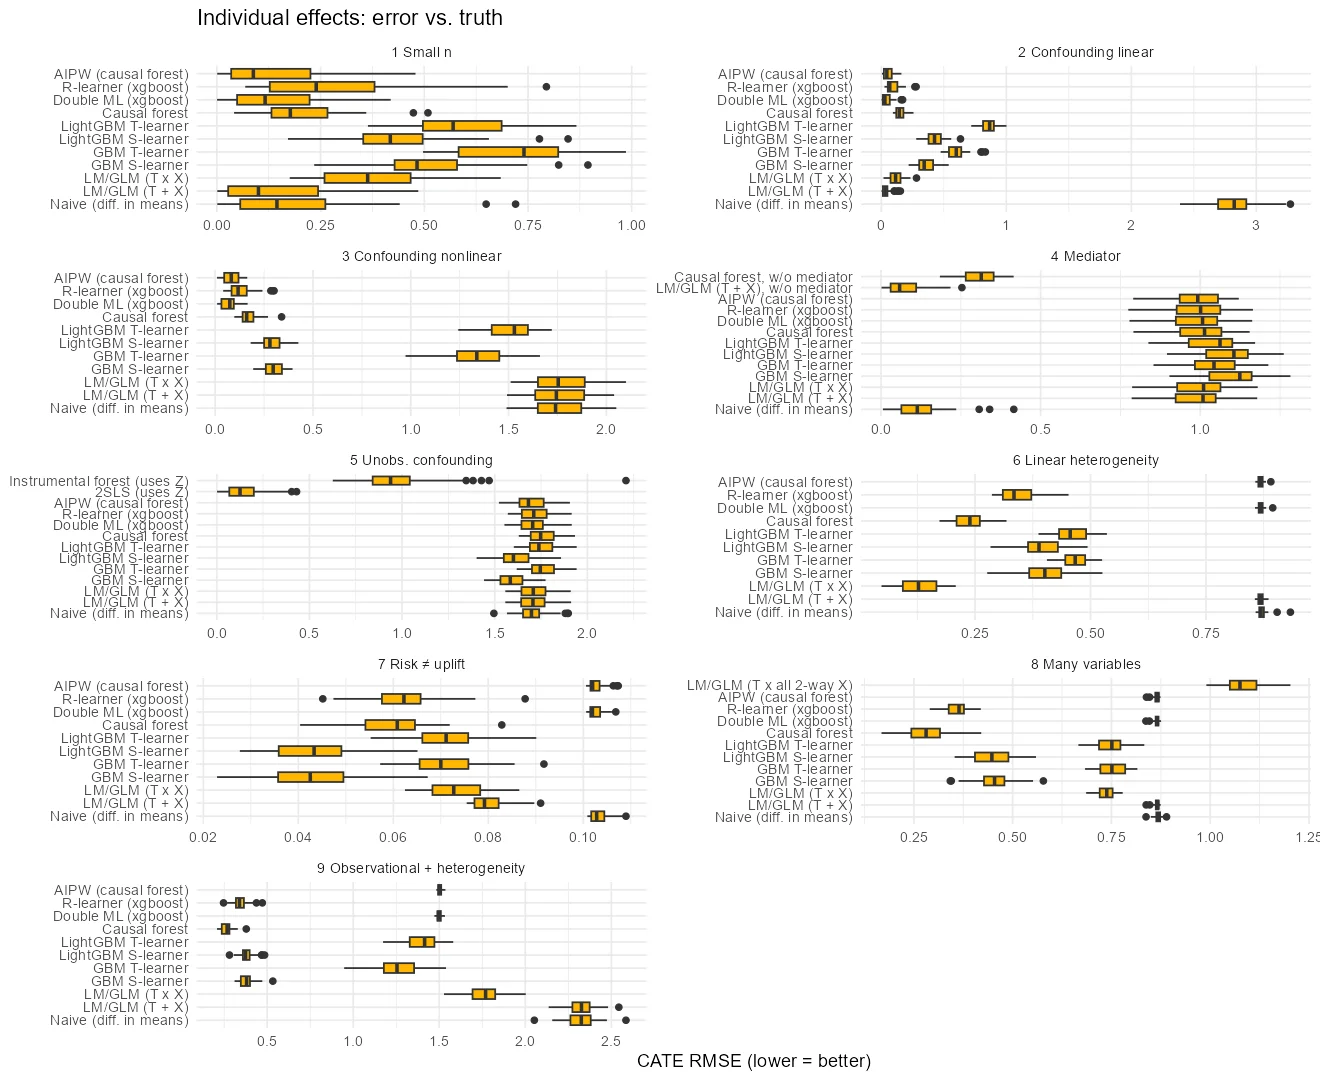
Nine simulations show that causal methods depend on sound data and a clear question; causal ML helps with nonlinear confounding and varied effects.
Six base R techniques cut grouped operation time and memory use by removing overhead around the per-group calculations.
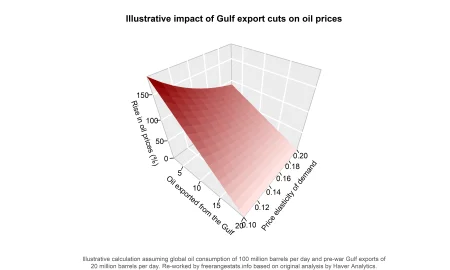
A line chart makes the link between Gulf oil exports, demand elasticity and possible crude price rises easier to read—and exposes the assumptions behind it.
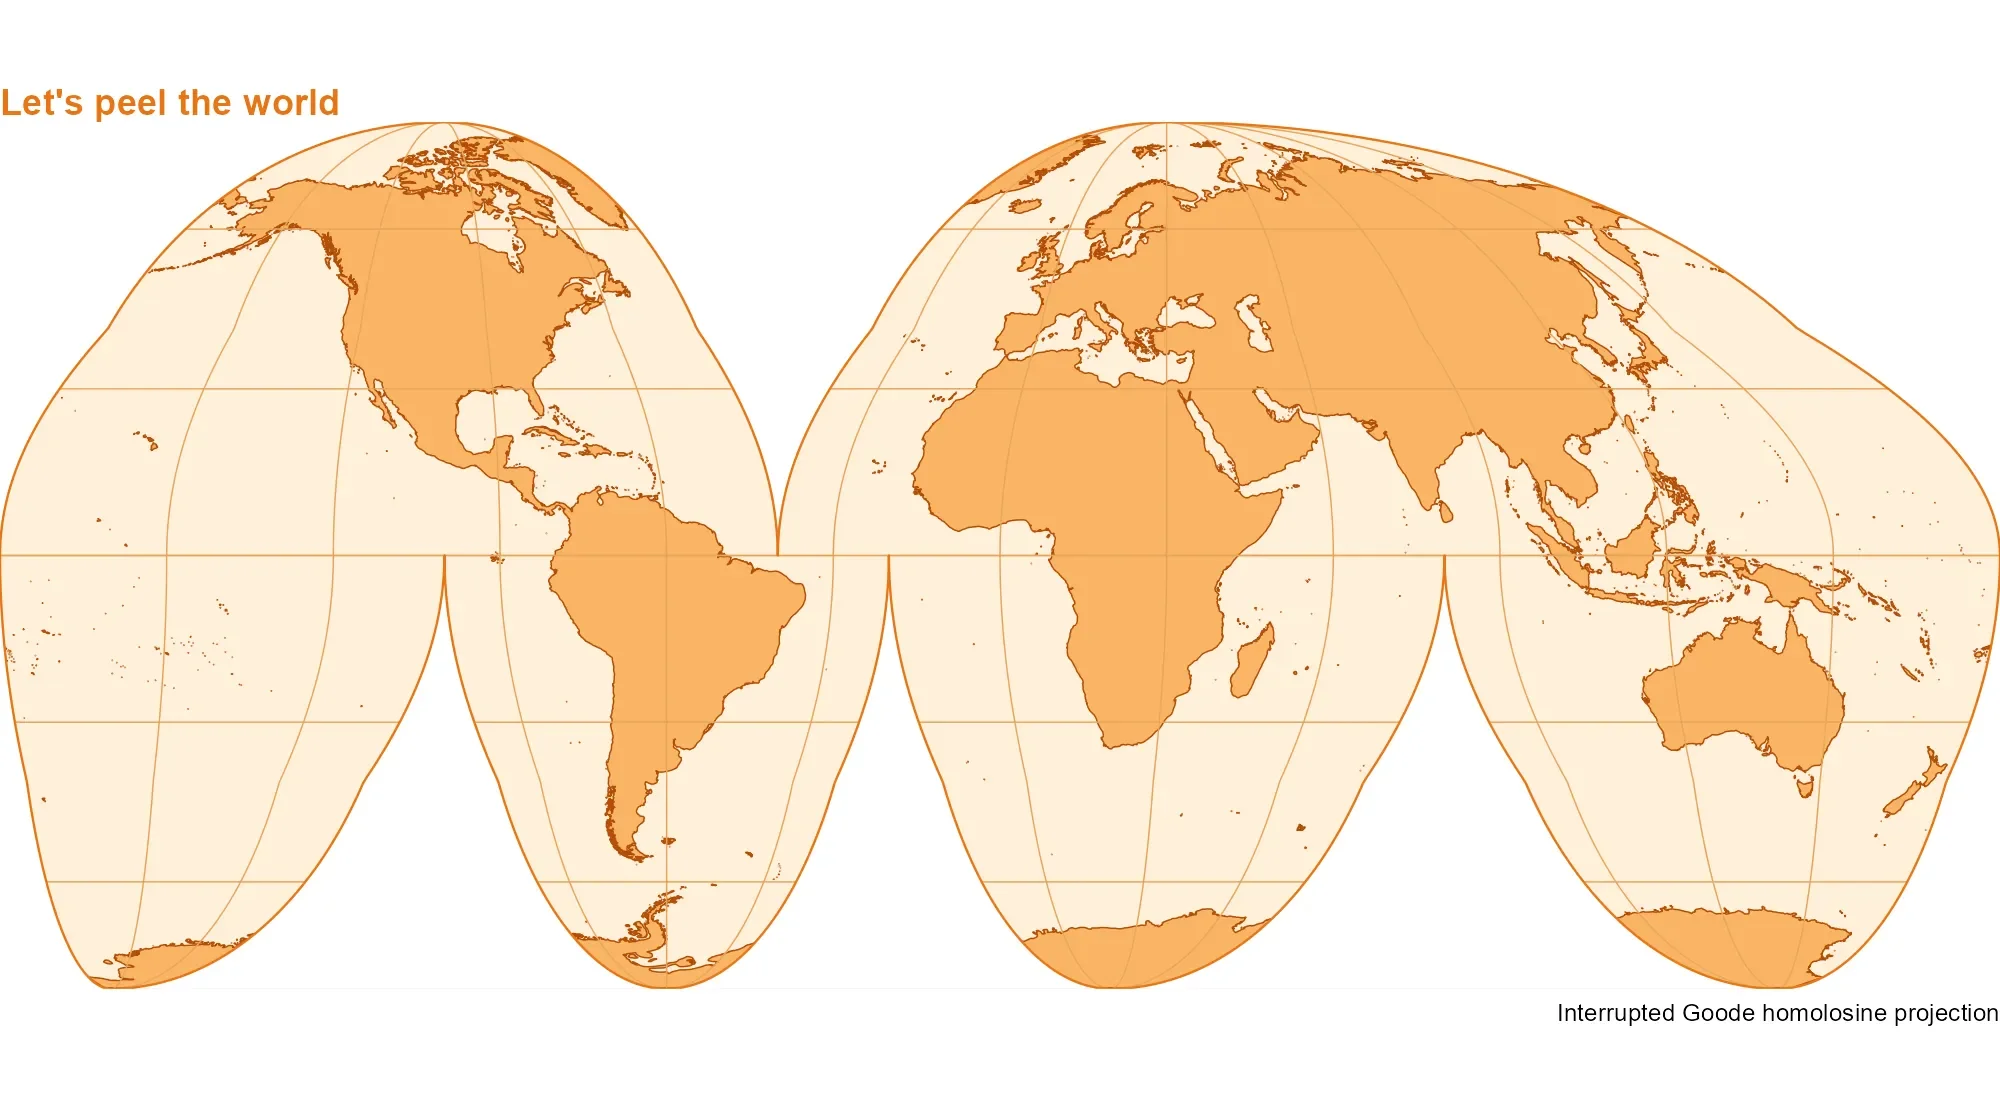
Combine sf, giscoR and ggplot2 to create an equal area world map with cleanly separated lobes, graticules and an orange palette.
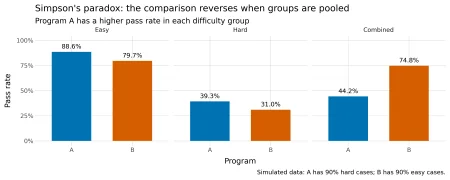
A Python simulation shows how exam difficulty and uneven group sizes can reverse pass rate comparisons, and why regression adjustment needs context.
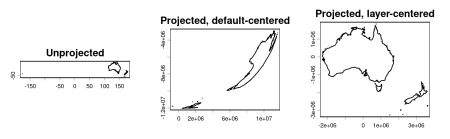
A terra wrapper centers projections on a map’s coordinates, helping reduce visual distortion in R visualizations.
Bioconductor’s experiment, workflows, and books repositories are now on R-Universe, alongside new Champions projects and community contributions.
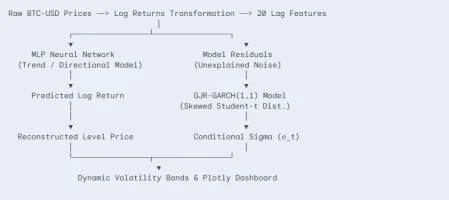
An MLP forecasts Bitcoin returns while GJR-GARCH models changing volatility, producing price estimates with uncertainty-aware bounds.
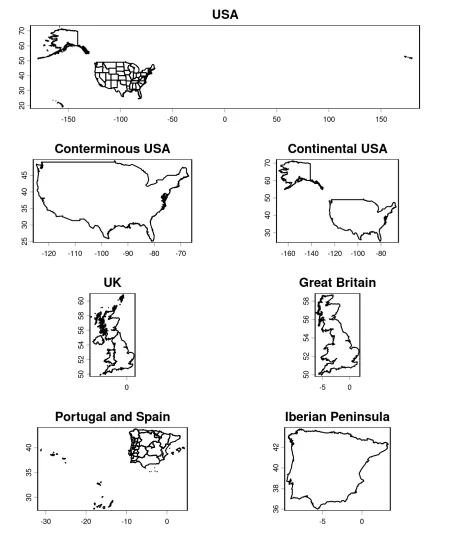
A compact terra function ranks polygon or line features by size, with options to dissolve borders and retain multiple parts.
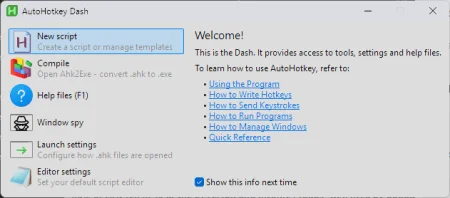
A Windows AutoHotkey workaround restores pipe and assignment shortcuts in Positron when Quarto visual mode intercepts them.
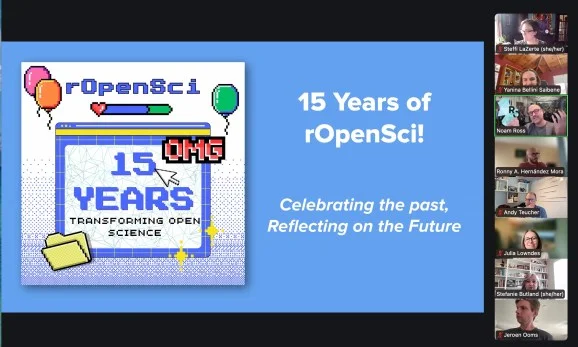
At 15, rOpenSci’s peer review, documentation and coworking continue to draw contributors. Members see new opportunities in local events, onboarding and open science.
The latest updates to the Matrix Profile tools in R streamline workflows while improving computational speed and accessibility for data analysts.