R Packages for Messy Data: Tools for Agriculture, Causal Inference and Climate Analysis
New R tools aim at problems where data rarely behave neatly
This opening group of packages has a practical theme: many tackle the awkward parts of real analysis, from incomplete observations and spatial dependence to uncertain model structure. That’s more interesting than a list of new functions. The packages offer ways to make those problems explicit, though their usefulness will still depend on the data and assumptions analysts bring to them.Agriculture
HRRI v1.0.9 focuses on soil, plant and microbial measurements collected across redox disturbance and recovery. It calculates potential oxygen demand from stoichiometry, estimates accessible electron capacity from supplied inventories and kinetic parameters, and provides recovery signatures and domain scores. Its exploratory multiblock scores also report observation coverage, a useful reminder that a composite result is only as informative as the measurements behind it. The methods draw on Sander, Hofstetter and Gorski (2015), Kluepfel et al. (2014) and Thompson et al. (2006). Three vignettes are available, including HRRI: Reading the Figures — A Worked Example and HRRI: Reproduce All Six Paper Figures in R. VeraCrop v0.1.0 automates much of the preparation and analysis involved in comparing agricultural performance. It detects variable types, preprocesses and encodes data, scales inputs, checks models, selects variables and computes yield gaps. The comparative performance method is described by de Bie (2004); for yield gap assessment, the package points to Kamkar et al. (2025). A getting-started vignette introduces the workflow.

Causal inference
In staggered difference-in-differences studies, treatment effects can vary by cohort and time. Estimating every cohort-time effect separately may be noisy; pooling them all can conceal real differences. phdid v0.1.0 treats the choice of which effects to pool as a partition-selection problem. It supplies a Dirichlet process mixture estimated with a collapsed Gibbs sampler and an L0-penalized estimator that returns one partition. The approach is set out in Arora and Wagle (2026). Its two vignettes show how partial homogeneity can be recovered in a minimum-wage and teen-employment example, and when that assumption helps or hurts. The central judgment is unavoidable: the model has to distinguish noise from genuine variation.
Climate studies
xaci v0.1.0 calculates the Actuarial Climate Index and its temperature, precipitation, drought, wind and sea-level components. It works with gridded NetCDF climate data and tide-gauge records, adapting a French and European methodology to any country. The method, described by Garrido, Milhaud & Olympio (2025), builds on the American Academy of Actuaries framework. Seven vignettes cover the package, including an introduction and visualizing ACI results. The global reach is useful, though the description alone doesn’t establish how comparable the resulting indices are across regions.
Computational methods
Several packages here give R users access to methods that would otherwise require more specialized implementations. koopman.dmd v0.2.2 combines Dynamic Mode Decomposition with Koopman operator methods, using a Rust backend throughextendr. Alongside standard DMD from Schmid (2010), it includes controlled DMD for forced linear systems, following Proctor, Brunton, and Kutz (2016). Extended DMD with lifting functions, Hankel-DMD with time-delay embedding, Generalized Laplace Analysis, harmonic time averages and mesochronic harmonic plots round out the methods described by Mezic (2020). The package has a vignette.
RcppTrust v0.1.0 brings derivative-based local optimization with trust regions to R and C++. Its methods are described as guaranteed to converge to a local minimum of the objective function. The thread-safe C++ port of the trust package is available as an R function and as a C-callable entry point, including for parallel C++ code such as nlmixr2est. Documentation is in the trust vignette.
For Bayesian hierarchical models, tulpa v0.7.5 offers spatial fields, temporal effects, spatially varying coefficients and multiple inference methods. Its spatial options include Hilbert space approximate Gaussian processes (Riutort-Mayol et al. (2023)), nearest-neighbor Gaussian processes (Datta et al. (2016)), intrinsic conditional autoregressive models (Besag, York, and Mollie (1991)), the reparameterized Besag-York-Mollie model (Riebler et al. (2016)) and stochastic partial differential equation fields (Lindgren, Rue, and Lindstrom (2011)). Temporal models cover random walks, autoregressive processes and Gaussian processes.
Its inference choices range from exact Hamiltonian Monte Carlo with the No-U-Turn sampler to Laplace and nested Laplace approximations with hyperparameter integration (Rue, Martino, and Chopin (2009)) and variational inference. Model-specific packages can connect likelihoods through a templated C++ callback interface. Three vignettes include Getting started and Spatial Fields. That range makes tulpa flexible; it also leaves users with consequential choices about approximation and computation.
WSwavelet v0.1.0 applies Bayesian wavelet denoising with a resolution-adaptive spike-and-slab prior. Its continuous slab mixes a compactly supported Wendland-type density with the semicircle density. The package supports Gaussian and Laplace working likelihoods, empirical-Bayes fitting of resolution-specific slab weights, robust noise-scale estimates, posterior-mean coefficient shrinkage, inverse discrete wavelet reconstruction and diagnostic tools. Details are in the vignette.

Ecology
Acoustic surveys depend on converting echoes into something biologically meaningful. acousticTS v2.0.8 works with acoustic target strength: the intensity of an echo from a single scatterer, such as a bubble, fish or zooplankton. Target strength can help turn integrated or volumetric backscatter into number density (for example, animals per ), abundance or biomass in kilograms. It can also help distinguish likely echoes from large predators such as adult cod and smaller prey such as shrimp. Applications appear in Lucca et al. (2023); the underlying fisheries acoustics principles are covered by Simmonds and MacLennan (2005). See the vignette.
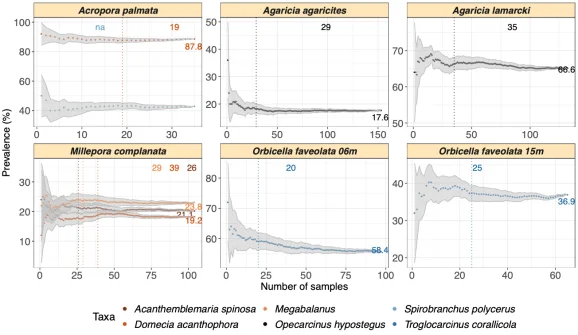
SAMPLE v1.0.1 estimates how much presence-absence sampling is needed to stabilize species occurrence and prevalence rates. It repeatedly subsamples observations, tracks changes in the estimates and reports a minimum stable sample size. The method is described by Bravo et al. (2025); the project’s GitHub page provides a starting point.
 Gridded environmental time series bring serial correlation, spatial dependence and multiple-testing problems together. sptrends v1.6.3 provides a reproducible framework for inference on spatiotemporal trends, including trend-preserving prewhitening, pixel-level and spatially explicit inference, slope estimates and multiple-testing correction. Dedicated workflows reproduce the True Significant Trends method of Gutiérrez-Hernández and García (2025) and the Robust Trend Analysis method of Gutiérrez-Hernández and García (2024). Utilities cover raster import and inspection, anomaly calculation and spatial autocorrelation diagnostics. Six vignettes include guides to serial correlation and trend magnitude estimation.

Economics
Pricing experiments often have to learn the demand curve while choosing prices. PricingBandits v2.1.0 implements multi-armed bandit methods for that problem, following Weaver, Kumar, and Jain (2025). It includes Upper Confidence Bound and Thompson Sampling baselines, Gaussian process methods, versions that constrain demand to be weakly decreasing as price rises, and extensions for heterogeneous noise. Users specify willingness to pay as a vector of consumer valuations, allowing different demand environments to be simulated or replayed. The vignette introduces the package.
Epidemiology
ambre v2.1.2 models quantitative microbial risk when treated wastewater is reused for agricultural irrigation. It follows pathogens through a multi-barrier treatment train, estimates human exposure and calculates infection and illness probabilities as well as Disability-Adjusted Life Years. The package also supports economic comparisons of treatment scenarios. Its framework is described by Thomas et al. (2024). Eight vignettes include a getting-started guide and guidance on interpreting risk against the WHO target. Nowcasting is complicated by the fact that reported counts change as late data arrive. tbl.now v1.2.0 defines tidy, package-independent data structures for epidemiological nowcasting. Its
tbl_now class tracks event, report and revision dates, along with strata, model-tagged covariates, censoring and reporting-delay metadata, while remaining compatible with dplyr. Tools support validation, data manipulation, diagnostics, visualization, format conversion, retrospective evaluation and multiple modelling engines. See the vignette.

Genomics
Genomics and machine learning
mSigSpectra v0.1.3 tackles a practical problem in mutation analysis: turning variant calls into comparable mutational profiles without tying the workflow to a particular caller. It reads VCF files, annotates variants with their flanking sequence and transcriptional strand, then builds catalogs for single base substitutions, doublet substitutions, and small insertions and deletions. Catalogs are available at ten resolutions—SBS96, SBS192, SBS1536, DBS78, DBS136, DBS144, ID83, ID89, ID166, and ID476—and as either counts or densities. The package was used in preparing Rozen et al. (2026); its vignette explains the workflow.

Machine learning
fastgbm v0.6.1 brings four modeling tasks under one gradient-boosting interface: squared-error regression; binary and multiclass classification using logistic and one-vs-rest approaches; and right-censored survival analysis. For survival models, users can choose Cox with Breslow ties, accelerated failure time with a normal location-scale distribution, or piecewise-exponential objectives. The package handles missing values natively and, for survival tasks, estimates baseline hazards and predicts survival probabilities. Training is deterministic across threads through RcppParallel. Its methods draw on Friedman (2001). Six vignettes are available, including getting Started and Algorithm.

xplaineff v0.1.1 addresses a familiar weakness in global feature-effect plots: an average can conceal effects that vary across the feature space. Its Generalized Additive Decomposition of Global EffecTs algorithm recursively splits that space into regions with more consistent effects, yielding a tree users can inspect. It supports both Accumulated Local Effects (ALE) and Partial Dependence (PD), works with mlr3 learners, and plots the interaction tree alongside regional effects. The approach is described by Herbinger et al. (2024); examples are in the vignette.

Medical statistics
chms v7.2 packages the ActiGraph wGT3X-BT accelerometer workflow developed by Statistics Canada for cycle 7 of the Canadian Health Measures Survey. The point is reproducibility: researchers can process data using a standardized method and align their analyses with Statistics Canada’s approach. General processing details appear in Clarke et al. (2026), with setup guidance in the README.
rsmart v0.1.0 is built for interim analysis of sequential multiple assignment randomized trials, or SMARTs. It implements an interim augmented inverse probability weighted estimator (IAIPWE) for treatment-regime value, encompassing both inverse probability weighting and augmented inverse probability weighting. Its tools cover value estimation, sandwich variance, group-sequential stopping boundaries, and sample-size calculations for multi-stage trials. The methods are detailed by Manschot, Laber, and Davidian (2023). Four vignettes include Getting Started and a full IAIPWE demo.

Meta-analysis, networks, and phylogenetics
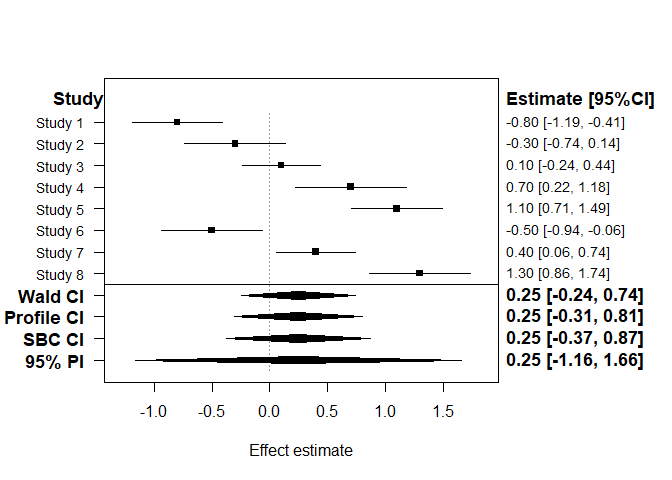
metaGLMM v1.0.0 takes random-effects meta-analysis into a generalized linear mixed-effects model framework. That lets analysts work with aggregate data while adjusting for covariates and handling non-normal responses, using likelihood-based inference with computationally efficient likelihood evaluation. The methodology is presented in Hanada and Sugimoto (2026). Seven vignettes include guides to getting started and prediction and forest plots.
nethist v1.0.0 estimates network histograms, blockmodel approximations of the graphon behind a network’s connectivity. It handles both single-layer and multilayer networks, drawing on profile likelihood from Olhede and Wolfe (2014) and least squares from Gao, Lu, and Zhou (2015) for single-layer data, plus the multilayer extension by Song and Olhede (2026). The vignette provides an example.

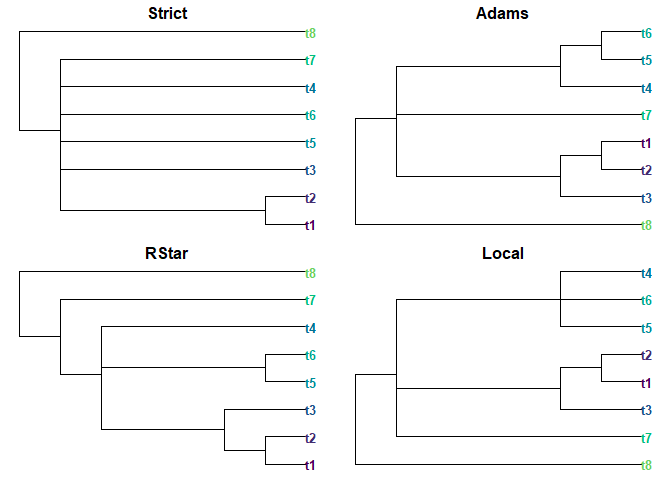
ConsTree v1.0.0 focuses on efficient phylogenetic consensus-tree construction, with a broad set of methods: strict, majority-rule, majority-rule (+), loose (combinable component, or semi-strict), greedy, Adams, frequency difference, R*, and local consensus. Its vignette walks through the package.
Statistics
attrition v1.0.0 targets randomized experiments where outcome data may be missing for reasons related to the unobserved outcomes. It implements the double-sampling bounds estimator from Coppock et al. (2017), alongside worst-case Manski bounds and Lee (2009) trimming bounds. For the latter, it offers analytic and bootstrap standard errors; for double-sampling bounds, it provides analytic variance and Imbens-Manski confidence intervals. The package also supports poststratification for covariate adjustment and sensitivity analysis when the outcome stability assumption may fail. See its vignette for details on the methods.

FitVerse v1.0-2 fits continuous univariate data against 52 parametric distribution families, spanning symmetric, right-skewed, heavy-tailed, bounded, and extreme-value shapes. It offers three estimation methods and selects candidate fits automatically using multiple criteria and tests. Diagnostics include publication-quality plots and histograms with density curves; optional interactive plots use plotly. Bootstrap confidence intervals for parameters and return levels, plus batch fitting across columns, round out the toolkit. The package is aimed at data characterization in survey sampling, hydrology, and actuarial work. For background, see Hosking (1990); examples are in the vignette.

hdcce v0.1.0 provides estimation and inference for panel-data models with interactive fixed effects. It covers the linear specification in Ruecker, Vogt, Linton, and Walsh (2025) and the dictionary-design approach in Ruecker, Vogt, and Linton (2026). The vignette introduces its use.
HDElliptical v0.1.3 collects methods for robust estimation, testing, dimension reduction, classification, and clustering on high-dimensional elliptically symmetric data. Its computational kernels use Rcpp and RcppArmadillo, and its methods follow the review in Feng (2026). Two entry points are the vignettes on Robust Directional Foundations and Location Tests.
iop v0.1.0 handles ordered probit and logit models with an inflated outcome category: one ordered value combines cases generated by the usual ordered process with cases from a separate split-population process. It fits the zero-inflated ordered probit introduced by Harris and Zhao (2007), along with middle- and top-inflated variants such as those discussed by Bagozzi, Joo and Mukherjee (2024). Available features include analytic, robust, and cluster-robust standard errors; survey weights and offsets; model comparison; and regime-specific predicted probabilities and first differences. Four vignettes cover the basics in Getting started and model identification and estimation in The model, identification, and estimation.
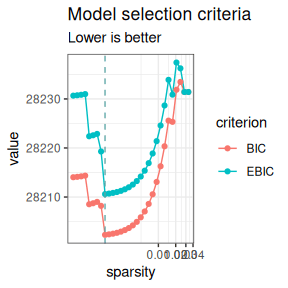
normalblockr v0.3.0 groups variables before estimating their statistical relationships. Its Normal-Block model is a Gaussian graphical model with latent clustering: building on the graphical lasso, it estimates dependencies between clusters rather than between every pair of individual variables. Users can supply known clusters or estimate them, and can add a zero-inflation extension for data with many exact zeros. The model and its variational expectation-maximization procedure are described by Tous & Chiquet (2026). Four vignettes include examples of Mean-Block models and Zero-inflated Normal-Block models.
mvdpd v0.1-1 applies Density Power Divergence (DPD) minimization to robust multivariate estimation. For multivariate normal data, it offers multivariate, composite, and componentwise approaches to casewise and cellwise contamination; for multivariate ordered gamma models, it provides multivariate and composite DPD methods. The details are in Ghosh, Agostinelli, and Basu (2026), with examples for mvnormDPD and mvogammaDPD.
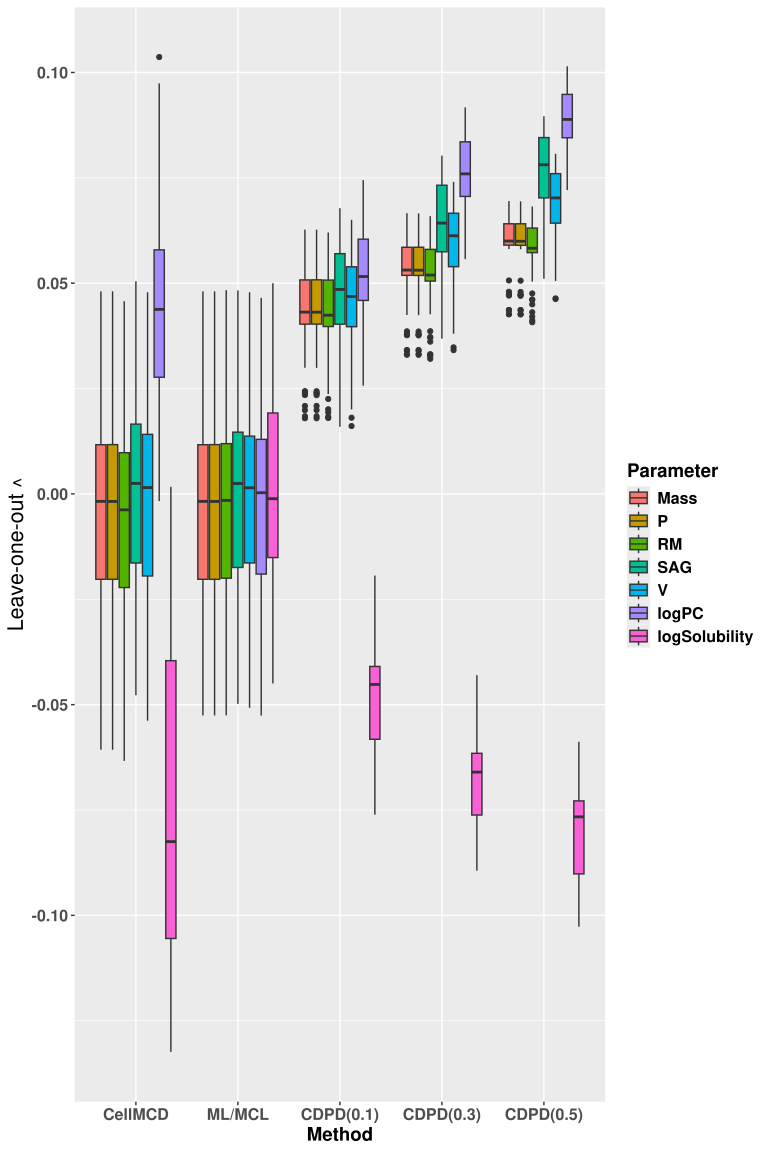
pmsims v1.0.0 turns sample-size planning for prediction models into a simulation exercise: it repeatedly generates data, fits models, and measures how sample size changes predictive accuracy, calibration, and overfitting. It supports continuous, binary, and time-to-event outcomes, and works with regression and machine-learning methods. The approach is described in Olaniran et al. (2026) and Shamsutdinova et al. (2026). See the vignette for an example workflow.

Modeling and survey quality
The modeling releases here tackle two very different problems: finding useful structure in high dimensional data, and accounting for zeros and spatial or temporal dependence in counts. spfcICOMP v0.1.0 implements shrinkage principal fitted components for dimension reduction in regression and classification. It combines regularized covariance estimates from Oracle Approximating Shrinkage and Maximum Entropy Covariance with structural dimension selection, response guided feature screening, reduced space prediction, and simulation tools. Its foundations include Cook and Forzani (2008), Chen et al. (2010), Bozdogan (2000), and Olorede and Yahya (2019). The getting started vignette shows how the pieces fit together.
ZINB.GP v1.0.0 takes on zero inflated negative binomial data with Gaussian process random effects, covering spatial, temporal, and spatiotemporal settings. Users can run Markov chain Monte Carlo, configure random effects separately for the zero inflation and count components, and draw from the posterior predictive distribution. The package implements a full Gaussian process version of the methods in He and Huang (2024). For practical examples, see Oregon Landslides and Simulating and Fitting a Spatiotemporal ZINB-GP Model.

Surveys
Representativeness is a quality question that can change while a survey is still in the field. risq v3.0.1 calculates representativity indicators from survey data and response models, including R-indicators and coefficients of variation. Partial indicators help identify the contribution of particular variables or categories; teams can track shifts during collection and use adaptive survey design to improve representation. The package draws on Schouten, Cobben, and Bethlehem (2009), Shlomo, Skinner, and Schouten (2012), and Schouten and Shlomo (2017). Its Introduction and Theory vignettes cover use and method.
Utilities
Several of these releases make data work easier to inspect or reproduce. dplyneage v0.3.1 draws column lineage through dplyr and dbplyr pipelines using React Flow. Its tidyverse style interface traces how pipeline operations transform data. The documentation includes Getting Started with dplyneage and Building the React Flow Bundle.

For R users working with lakehouse data, ducklake v0.6.0 offers a tidyverse friendly way to attach and query versioned DuckLake data lakes through familiar dplyr verbs. The package supports ACID transactions, time travel queries, snapshot audit trails, data inlining, encrypted storage, and remote access via the ‘Quack’ protocol from DuckDB. Catalog options include DuckDB, PostgreSQL, SQLite, and MySQL. There are nine vignettes, among them the ducklake Cookbook and Time Travel Queries. The breadth of features is appealing, though the right fit will depend on which catalog and access patterns your work needs.
Reproducibility also depends on data that can't sensibly ship inside a package. getaca v0.1.6 provides functions to declare, retrieve, verify, track, and manage external dependencies that are too large or change too quickly to bundle. It identifies resources by package, name, and version, then pins them with a SHA-256 checksum and an explicit resolution policy so an installed package can retrieve the same bytes consistently. A remote registry can be signed with Ed25519 and checked against a key shipped by the declaring package, keeping the registry and its verification key on separate routes. The design targets offline reproducibility and predictable behavior during package checks. Eight vignettes include Quick Start and Policies and Channels.
icebergr v0.2.0 brings a native R client to Apache Iceberg, the open table format used by Snowflake, Databricks, BigQuery, AWS, and Dremio. It connects to REST and AWS Glue catalogs; lists namespaces and tables; reads table schemas and partition specifications; pushes predicates and projections into scans; navigates snapshot history; and appends data. Apache Arrow serves as the interchange layer. The README spells out supported and unsupported features, while seven vignettes include Getting Started and What Iceberg Is, and What It Fixes.

For maintainers preparing an rOpenSci submission, pkgcheck v0.3.4 checks readiness for the rOpenSci peer review process. It builds on goodpractice and adds checks, including ones covering maintenance of public code repositories. Its four vignettes include Current checks and Adding or modifying checks.
Visualization
One release looks backward for its visual language. ggCheysson v1.1.0 brings the fonts, hatched patterns, and color palettes associated with Emile Cheysson and the Albums de Statistique Graphique into ggplot2. Those albums are often described as a high point of the Golden Age of Statistical Graphics. The package’s three vignettes include Getting Started and Mapping Guerry’s Moral Statistics with Cheysson Palettes. It’s a focused tool, but one with a clear point of view: historical graphic conventions can still give modern plots a distinctive visual grammar.



