R Function Centers Map Projections on the Data for Clearer Visualizations
Projection defaults can place a map far from the center of its plotted features, making the result harder to read. A new R helper, projectCentered, addresses that by deriving the projection’s center from the input layer before transforming it with the terra package. That’s a small change to the projection workflow, but it targets a familiar cartographic annoyance: a projection can be mathematically valid and still frame the data awkwardly. When the area of interest sits far from the projection’s default center, the map may look lopsided or place the features in an unexpected part of the plotting area.
Centering the projection on the layer
The function accepts a SpatRaster or SpatVector and a PROJ projection name, defaulting to Lambert Azimuthal Equal-Area (laea). It checks that the input has a coordinate reference system, then finds a center point from the layer’s geometry. That check matters because coordinates without a known reference system can’t reliably be interpreted as locations on Earth; the helper stops rather than guessing. Raster data is converted to polygons for that step, while a vector with multiple features is aggregated so the center reflects the collection as a whole. If the geometry isn’t already in longitude and latitude, the helper first transforms it to EPSG:4326.
It then builds a projection string with lat_0 and lon_0 set to the calculated center and projects the original layer. This separates two jobs: the helper uses a geographic representation to find the center, then applies the requested projection to the original data. Invalid projection names produce an error identifying proj as the problem, which gives the caller a more focused clue than a generic failure from the projection step. Here's the thing: automatic centering improves the starting frame, but it doesn't decide whether a projection is suitable for every map or every analytical task.
projectCentered <- function(x, # SpatRaster or SpatVector proj = "laea" # +proj parameter for PROJ.4 string ) { # version 1.0, by A. Marcia Barbosa stopifnot(inherits(x, "SpatRaster") || inherits(x, "SpatVector")) if (terra::crs(x) == "" || is.na(terra::crs(x))) { stop("'x' does not have a CRS to project") } if (inherits(x, "SpatRaster")) { a <- terra::as.polygons(x * 0) } if (inherits(x, "SpatVector") && length(x) > 1) { a <- terra::aggregate(x) } else { a <- x } if (!isTRUE(terra::is.lonlat(a))) { a <- terra::project(a, "EPSG:4326") } centr <- terra::crds(terra::centroids(a)) proj <- tolower(proj) proj <- sub("+proj=", "", proj, fixed = TRUE) # in case user input prefix CRS <- paste( paste0("+proj=", proj), paste0("+lat_0=", centr[2]), paste0("+lon_0=", centr[1]) ) tryCatch(terra::project(x, CRS), error = function(e) stop("'proj' is invalid"))}
What changes in practice
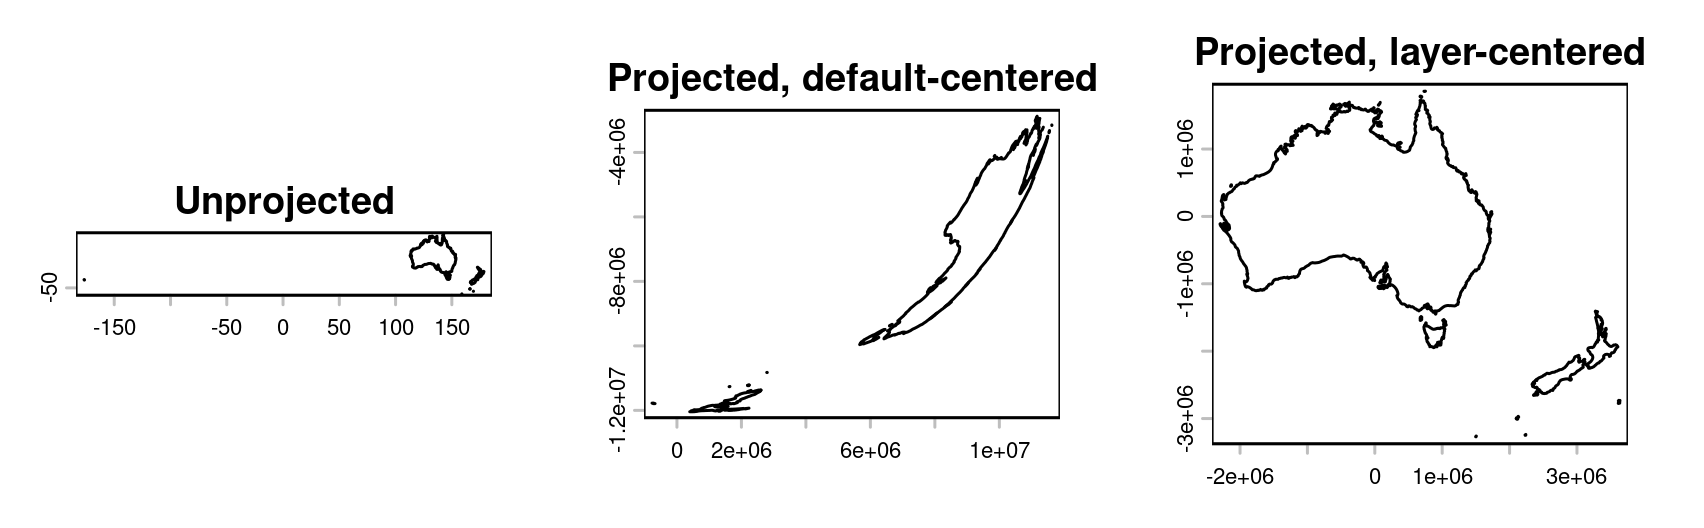
The example uses geodata to load country boundaries, selects New Zealand and Australia, and compares three views: the unprojected map, a default-centered Lambert Azimuthal Equal-Area projection, and the same projection centered on the selected map. The comparison shows why choosing the center from the data can improve the framing. It also makes the tradeoff visible: the map’s appearance depends not only on which projection is chosen, but on where that projection is centered. This is more significant than it looks when a plot is meant to communicate the position and shape of a particular group of features.
In the code, the first panel provides a geographic reference, while the next two hold the projection type constant and change the centering. That makes the comparison useful for understanding the helper’s specific contribution. A projection changes how locations are represented on a flat surface; changing its center changes how that representation is arranged around the area being shown. The example doesn’t establish that one framing will suit every audience or map, but it gives readers a direct way to judge whether the default view is distracting from the subject.
library(terra)library(geodata)countries <- geodata::world(path = tempdir())map <- subset(countries, countries$NAME_0 %in% c("New Zealand", "Australia"))par(mfrow = c(1, 3))plot(map, main = "Unprojected")plot(project(map, "+proj=laea"), main = "Projected, default-centered")plot(projectCentered(map, "laea"), main = "Projected, map-centered")
Useful framing, with limits
There’s an important boundary to the helper’s use: it’s intended for visualization. Area and distance calculations should account for Earth’s curvature with spherical geometry or geodesic methods. A projection that makes a map easier to inspect isn’t automatically the right basis for measurement, because flat map coordinates can represent distances and areas differently depending on the projection and the location. The author recommends doing those calculations with longitude and latitude coordinates rather than relying on this display projection.
If you're working in this space, the distinction is practical: choose a projection to communicate spatial relationships clearly, then use methods suited to the measurement you actually need. And this is the part most people overlook: a well-centered map can look more persuasive without making its measurements more trustworthy. The helper addresses presentation, not the underlying limits of projecting a curved surface onto a plane. A clearer frame. That said, the example’s three-panel comparison makes the visual effect easy to assess before using the helper in another map.
Implications for everyday mapping
The example keeps the map styling minimal, and the author notes that terra with base R plotting can produce more polished maps without adding package dependencies. That keeps the demonstration focused on the projection itself, while also pointing to a useful workflow for readers who want to refine the output using tools they already have. Styling and projection solve different problems: one shapes the map’s visual presentation, while the other determines how geographic coordinates are laid out.
The practical takeaway is straightforward: center a projection on the features being shown when the goal is a clearer view, and choose curvature-aware methods for measurement. projectCentered puts that framing step into a reusable helper, which may save repeated manual adjustments in exploratory mapping. Its value will depend on the layer and the intended view, so the resulting map still deserves a visual check. Better framing, with a clear boundary around what it can tell you.


