Clinical Medicine Leads Stanford–Elsevier’s Top-Cited Scientist Rankings
The U.S. leads clinical medicine by total researchers, while Switzerland and Denmark rank highest per resident in the 2026 Stanford–Elsevier list.
Data analysis, big data, and business intelligence
Found 323 articles
The U.S. leads clinical medicine by total researchers, while Switzerland and Denmark rank highest per resident in the 2026 Stanford–Elsevier list.
Five in-person workshops at the University of Queensland span R fundamentals, modelling and spatial analysis, with registration open for February 2027.
Follow MICE’s chained conditional models in R, generate ten completed datasets, and compare the results with the mice package.
A searchable leak reportedly exposes contact details, roles and system access for more than 41,000 DHS staff, including CBP, ICE and CISA personnel.
New R packages help analysts address incomplete measurements, variable treatment effects and climate data, with workflows that make assumptions and data coverage more visible.
La baisse du prix des jetons ne garantit pas des économies : les erreurs, les reprises humaines et la dérive du modèle déterminent le coût réel.
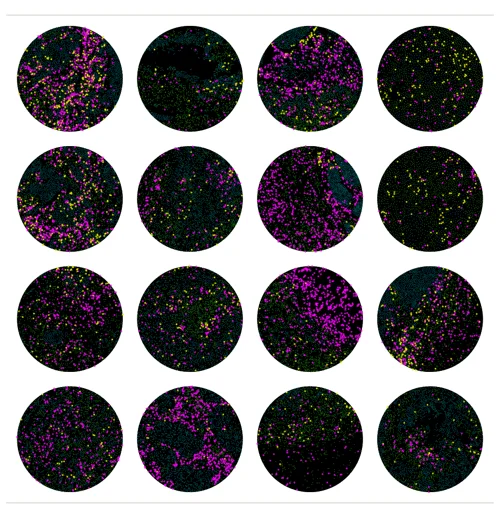
sccomp models cell counts across repeated biopsies and nested tissue regions, accounting for patient-level variation, outliers, and changes in cell composition.
AtlasCore, PolyFucked, and Magnetic Team package fake prediction markets with crypto payments, AI-assisted outreach, and controls that block withdrawals.
A free webinar on using R for dependable agent calculations, with practical guidance on user sessions, testing, action logs and safeguards.
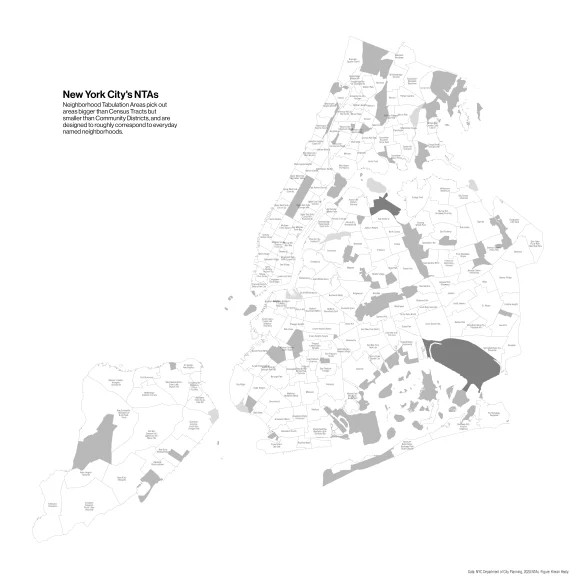
A study of 13.5 million NYC 311 reports uses address-level counts to map each neighborhood’s most distinctive complaints.
FAIR principles make WASH data easier to find and reuse, while CARE principles center community rights, control, and benefit.
Whole-GPU allocation and weak workload visibility drive waste in Kubernetes inference. Engine-level metrics can guide safer sharing and autoscaling.
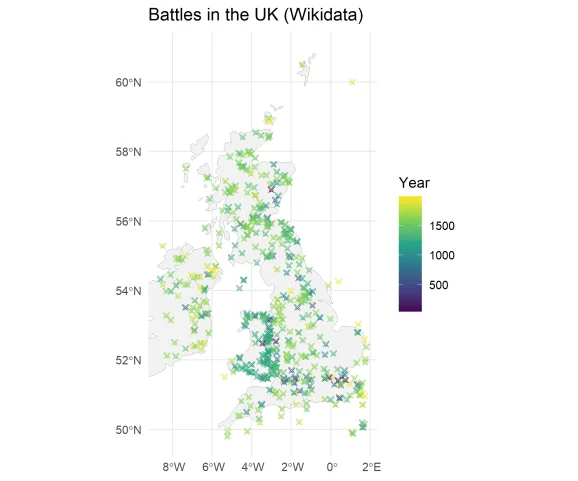
A Hilbert curve maps roughly 550 UK battles onto a time-and-location plot, revealing patterns that are hard to see on a conventional map.
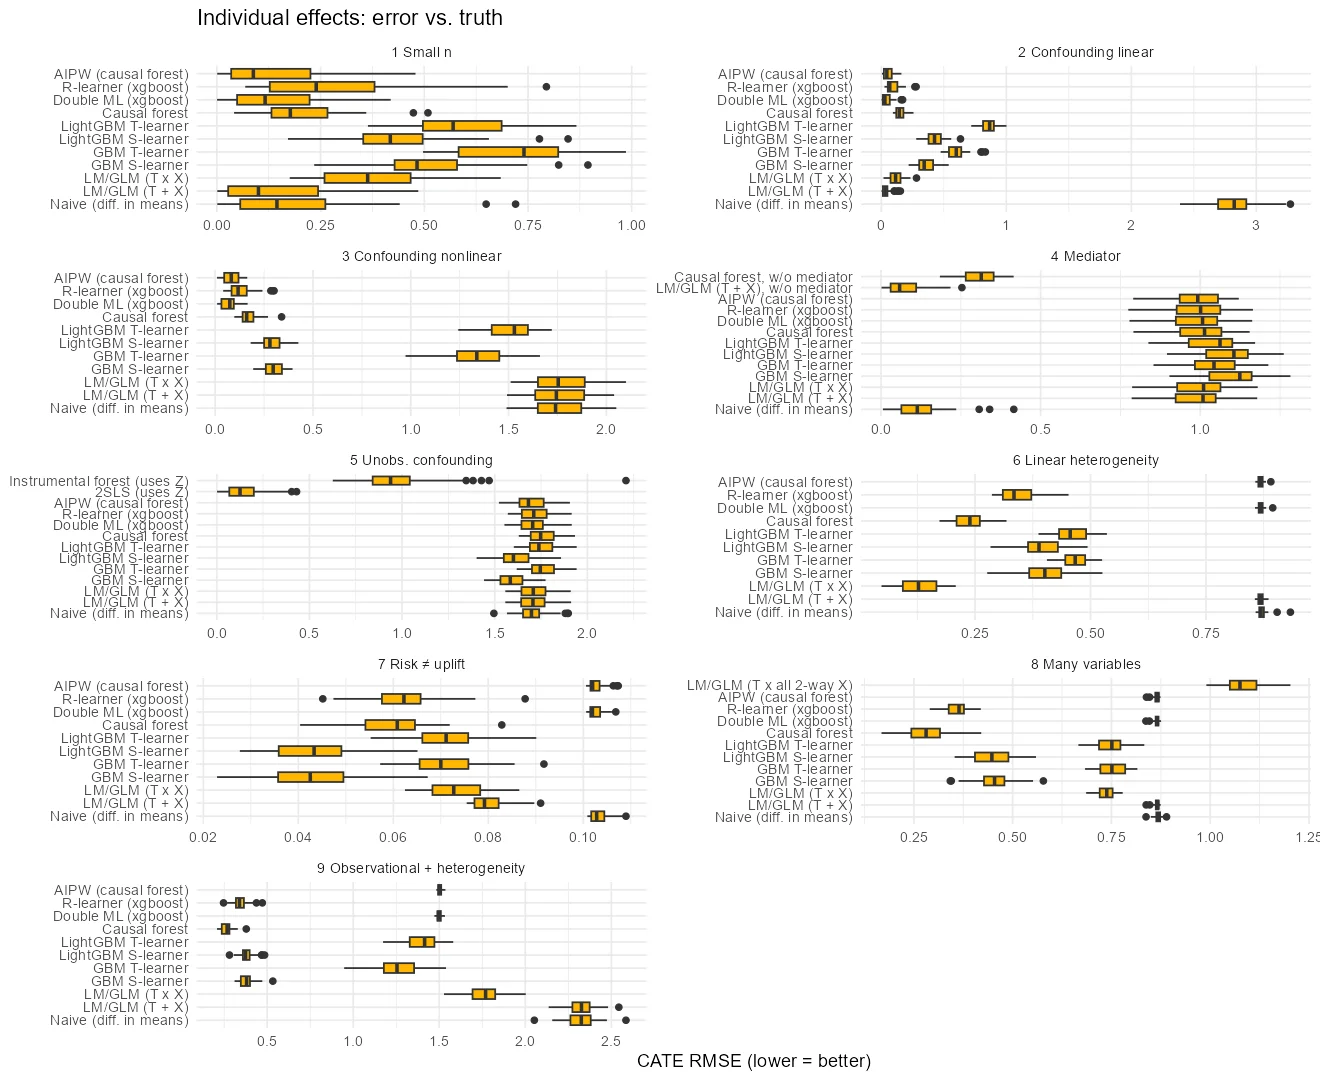
Nine simulations show that causal methods depend on sound data and a clear question; causal ML helps with nonlinear confounding and varied effects.
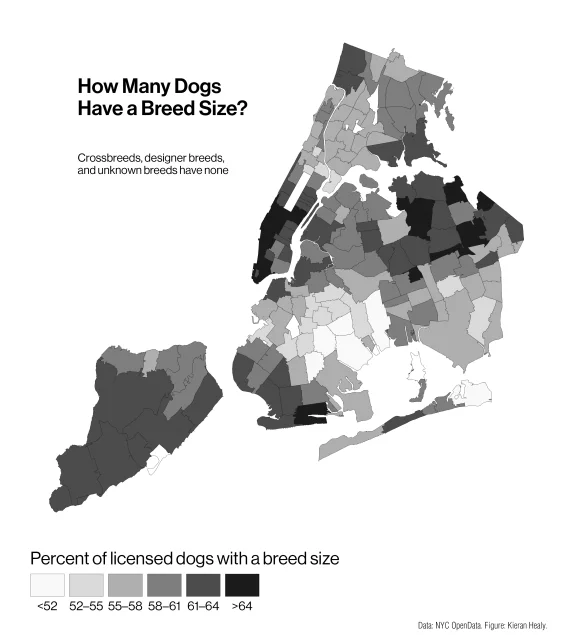
Breed data suggest New York’s higher-income ZIP codes have larger dogs, while housing size adds little to the pattern.
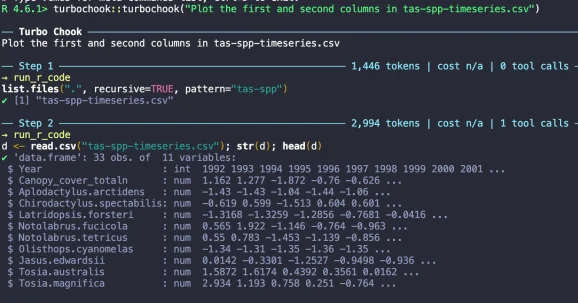
An R tutorial shows how to connect an LLM, register tools and build an agent loop, with the turbochook package offering three modes.
Six base R techniques cut grouped operation time and memory use by removing overhead around the per-group calculations.
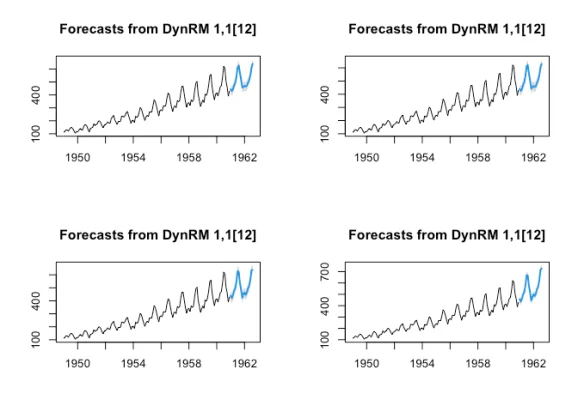
The caretS3 package fits glmnet and glm models on tabular data and plugs into ahead::dynrmf for 20-step AirPassengers forecasts.
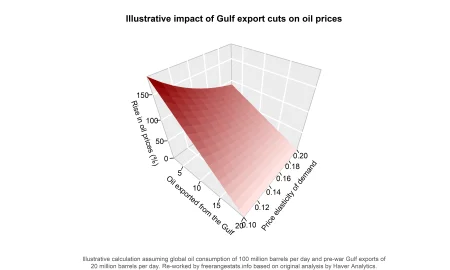
A line chart makes the link between Gulf oil exports, demand elasticity and possible crude price rises easier to read—and exposes the assumptions behind it.
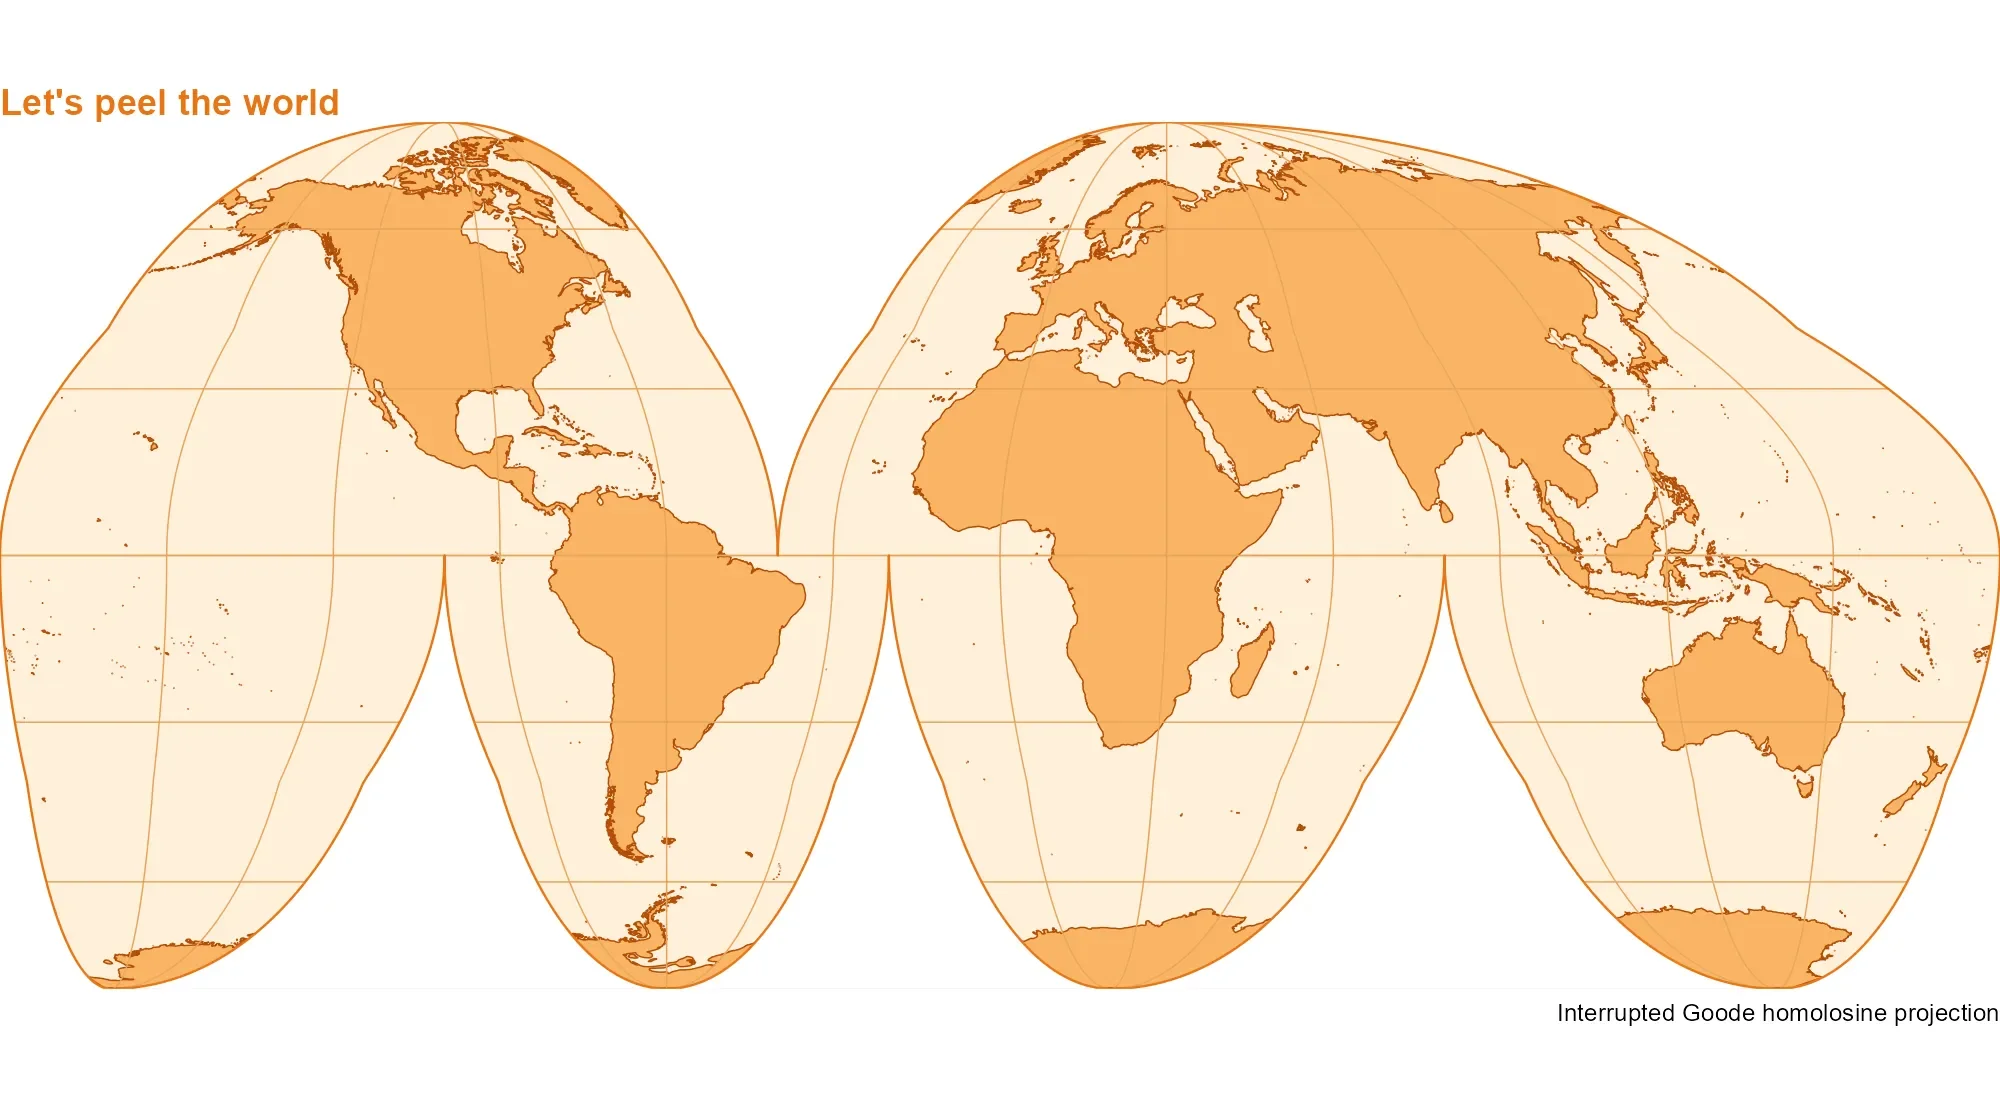
Combine sf, giscoR and ggplot2 to create an equal area world map with cleanly separated lobes, graticules and an orange palette.