What 30 Years of Governance Data Reveal About Growth, and Where It Falls Short
Three decades of data point to a real connection—and plenty of caveats
Population-weighted rule-of-law scores have fallen globally since 1996. India and the United States account for much of that drop; China’s overall contribution is close to zero because its score recovered after declining in the mid-2000s. At the same time, countries with stronger rule of law tend to be richer, and countries whose scores improve tend to grow faster. Those patterns are meaningful, but they don’t make the rule of law a reliable growth formula: China, Armenia, Bosnia and Herzegovina, Guyana and Myanmar all grew faster than their rule-of-law changes alone would suggest.
That tension is the point. The rule of law and economic performance move together often enough to merit attention, but country-level comparisons can’t by themselves establish which causes which. If you’re working with these indicators, the exceptions matter as much as the broad trend.
Why examine the relationship
A 2025 project on economic growth and the rule of law, undertaken for the Bingham Centre for the Rule of Law and the Law Society of England and Wales, prompted this analysis. For a deeper review of the research, see Dr Lopez-Gomez’s literature review.
This is the fourth installment in a series examining how to measure the rule of law and how it relates to other outcomes. The earlier pieces cover whether the WGI can stand in for the WJP index, how well the WGI predicts WJP scores, and why correlations between institutions are hard to interpret. Together, they make two useful points: the Worldwide Governance Indicators (WGI) provide a credible proxy for the World Justice Project’s (WJP) rule-of-law measure, with broader coverage over a longer period; and simple pairwise comparisons can mislead when institutions are difficult to measure, jointly determined and connected to one another.
Four patterns to keep in view
The analysis focuses on four findings that frame the discussion ahead:
- Global rule-of-law scores have declined since the mid-1990s.
- Countries with stronger rule of law tend to have higher incomes.
- Countries that improve their rule of law tend to grow faster.
- Rule of law is neither required for growth nor enough to guarantee it.
The broad associations are clear enough to be interesting. Their limits are just as important.
Why cross-country comparisons can mislead
Country-level analysis compresses complicated systems into a handful of measures. That’s useful for spotting patterns, but it makes causal claims difficult.
- Institutions are hard to define and measure. They include formal rules and informal norms, from peaceful transfers of power to everyday workplace habits. Perception-based measures add another layer of uncertainty: respondents asked about the rule of law may also be judging democracy, accountability or government effectiveness, perhaps against Western models of governance.
- Institutions and economic outcomes affect one another. A legal system may support growth, while growth may give governments more resources to fund that system. Since institutions operate together, it’s difficult to isolate the rule of law as a separate cause. The previous analysis on institutional correlations explores this problem.
- National averages can hide the mechanisms that matter. Economic and social relationships sometimes cross borders, while cross-country analysis treats the nation-state as its unit. Research on relationships that extend beyond national borders illustrates the gap.
- Institutions change slowly. The data here span 1996 to 2023—nearly three decades—but that may still be too short to capture long-run relationships. Leading studies examine periods of more than a century (one; another). Findings from this window may not hold over longer stretches of history.
These four themes were chosen because the research literature gives them support, with relevant studies cited throughout the analysis. That support doesn’t remove the measurement and causality problems; it gives a reason to examine the patterns carefully.
Data and measurement choices
The rule-of-law series comes from the World Bank’s 2025 release of the WGI Rule of Law measure, which covers 1996–2024.1 It estimates the quality of contract enforcement, property rights, police and courts, as well as exposure to crime and violence. The WGI was selected for its wider country coverage and longer time span; earlier comparisons in this series found it to be a reliable proxy for the more detailed WJP measure. The WGI data used here are available for download.
Economic measures—GDP per capita at purchasing-power parity, GDP-per-capita growth, population, and oil and gas rents—come from the World Development Indicators (WDI), accessed through the wbstats package. The country’s World Bank region is included as well. These figures were downloaded on 22 October 2026 and saved as a fixed snapshot, so later revisions to World Bank data won’t alter the results. The snapshot used in the analysis is available.
Income groups use each country’s earliest available World Bank historical classification, usually based on income in 1987, rather than its current group. The World Bank classification records provide the historical data. Pacific island small states follow the Bank’s current grouping in its country classification file, CLASS.xlsx, downloaded on 7 November 2026 from the same classification page.
Two geographic measures—the share of each country’s population within 100 kilometres of a coast or navigable river, and a malaria index—come from the geography dataset by Gallup, Sachs and Mellinger.2 It was downloaded on 7 November 2026 from RePEc.
For the analysis, the WGI series is limited to 1996–2023, the last year with near-complete WDI coverage across most measures. Countries with fewer than 20 years of growth data are excluded. Oil and gas rents are averaged across 2019–2023; countries where those rents exceed 10% of GDP count as large producers. Groups with fewer than five countries are omitted from the correlation chart, and countries more than two standard deviations above the growth line are labelled. WGI scores run roughly from −2.5 to +2.5, centred on the average country; chart colours mark declines in red and improvements in green.
The code that follows sets up the analysis in R. It loads tidyverse, readxl, janitor and ggrepel; defines file paths, years, sample cut-offs, indicator codes and chart styles; then imports the WGI and WDI data and aligns country codes. The WGI Rule of Law sheet supplies estimates and standard errors. Six older country codes are mapped to ISO codes: ROM to ROU, ZAR to COD, TMP to TLS, ADO to AND, KSV to XKX and WBG to PSE.
Historical income groups are assigned using each country’s earliest available classification to reduce the chance that group membership simply mirrors current rule-of-law scores and economic conditions. It’s an imperfect workaround for simultaneity, and the analysis notes that an instrumental-variable approach would require a suitable instrument.
Building a comparable country panel
The analysis starts by fixing each country’s income group at its earliest recorded World Bank classification. That choice gives the later comparisons a consistent baseline, but it also means some countries scored in 1996 have no income classification until years later. The World Development Indicators data covers 1996 through 2023, downloaded on 22 October 2026. World Bank regional labels are attached to each country, and aggregate entries such as “World” are removed. For income groups, the historical classification sheet spans fiscal years FY89 to FY27. After excluding its headings, calendar year row and notes, the data is reshaped by country and fiscal year. Footnote markers are stripped from codes such as Yemen’s “LM*”; “..” entries are excluded as unclassified years. The first valid classification is then retained for each country. That produces four starting groups: 54 high income countries, 51 low income, 78 lower middle income and 40 upper middle income. For later charts, the three groups below high income are combined into “Low & middle income.” The WGI rule of law scores are joined to the WDI data by country code and year, then matched to those starting income groups. Nine WGI economies have no WDI match: French Guiana, Martinique, Taiwan (listed as Taiwan, China), Anguilla, the former Netherlands Antilles, Réunion, Cook Islands, Niue and Jersey. Most are territories or economies outside the World Bank’s coverage. Four economies have rule of law scores in 1996 but were first classified by income after that year: Naoero in 2017, Palau in 1998, Serbia in 2008 and Tuvalu in 2011.A global decline, with an important caveat
The headline pattern is a worldwide fall in rule of law scores between 1996 and 2023. It’s more pronounced when the average is weighted by population, which gives a better sense of the change experienced by the average person. The unweighted average instead tracks the average country. Both calculations use the same countries that had scores in 1996, keeping the comparison set fixed over time. A 2025 revision to the World Bank’s WGI methodology improved the comparability of scores across years. Even so, the unweighted declines only narrowly clear the measurement error bands. Those bands use the WGI’s standard errors; overlapping intervals offer a conservative indication that two scores may be indistinguishable. Kaufmann, Kraay and Mastruzzi discuss this approach in their [note on analytical issues with the WGI](https://www.gilesd-j.com/2026/11/11/the-rule-of-law-and-economic-growth-what-three-decades-of-data-show/#fn3). The population weighted score fell by 0.22 points. That’s a real governance shift, but it needs scale: the 2023 score gap between Denmark and New Zealand was 0.31. The global decline deserves attention; it doesn’t, by itself, show that the world is becoming lawless.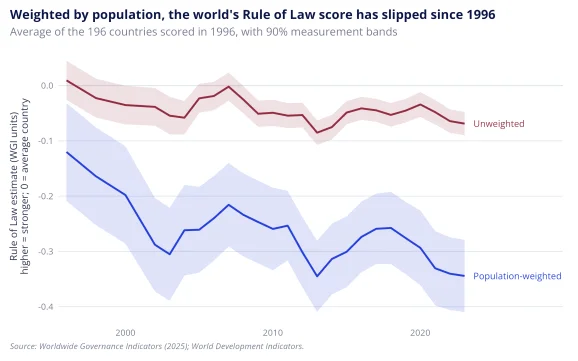
India’s weight in the global average
The five most populous countries in 2023—China, India, Indonesia, Pakistan and the United States—accounted for 46% of the world’s population. Their score changes therefore carry unusual weight in a population weighted global average. India, the United States and Pakistan saw declines; Indonesia improved; China ended the period close to where it began. India is the key driver here. Its decline was smaller than those in the United States and Pakistan, but its much larger population gave it greater influence on the global result. That’s a useful reminder: a country’s contribution to a weighted average depends on both its score and its share of the population. Country level uncertainty complicates the picture. India’s decline falls within the measurement error bounds, as does China’s near flat result, so neither establishes a clear change in institutional quality. The United States’ decline and Indonesia’s improvement are large enough to stand out from those bounds. If you’re reading the global average as a simple verdict on every country, that distinction matters. The country comparisons show the five nations’ scores in 1996 and 2023, alongside their trajectories across the intervening years.Rule of law and income move together, but the scatter doesn’t prove why
The broad pattern is clear: countries with higher rule of law scores tend to have higher incomes. The 2023 comparison uses GDP per capita adjusted for purchasing power parity, so a dollar represents roughly the same real purchasing power across countries. That makes the association easier to compare, but it doesn’t establish that stronger rule of law caused a country to become richer.5
The trend line also makes the exceptions visible. Countries to its right have higher incomes than their rule of law scores would predict; some depend heavily on oil and gas rents, which may weaken incentives to build institutions that serve the wider public.6 Countries below the line include many Pacific island economies and countries in Sub-Saharan Africa. Remoteness and small domestic markets can constrain trade in the Pacific; in parts of Sub-Saharan Africa, governance challenges and limited access to navigable rivers are among the geographic and institutional constraints.7
Here’s the thing: secure, predictable property rights can make commerce easier, and there’s a substantial body of research examining that proposition.8 But a country-level correlation is only a starting point. It can’t tell us how much of the relationship runs from law to income, how much runs the other way, or what other forces shape both.
There’s also a deeper measurement problem. Rule of law helps determine what people can own, price and trade, while political and economic conditions shape the rules themselves. That overlap creates a form of conceptual endogeneity: stronger legal protections can expand what enters markets, and therefore what GDP records.91011 GDP also tracks outcomes people care about, including life expectancy and wellbeing, so the association still matters. It just isn’t a clean test of two independent forces.
Note: Oil and gas rents are the value of production minus extraction costs, expressed as a share of GDP, using the World Development Indicators.