Exploring the Latest Release of Spurious Correlations: Version 0.2 Now Available
The Spurious Correlations package has officially launched version 0.2 on CRAN, continuing its mission to spotlight humorous and perplexing data correlations that often trick the eye. Inspired by Tyler Vigen's work, this project underscores how statistics can mislead when presented without appropriate context. However, as of October 9, 2023, the original website seems to be offline, prompting developers to utilize an archived snapshot to preserve the dataset as of June 7, 2023. This unfortunate turn raises questions about the sustainability of such projects, particularly when the community relies heavily on certain online resources.
Getting Started
Users can easily install the Spurious Correlations package from CRAN with the following command:
install.packages("spuriouscorrelations")
For those interested in the latest updates, the development version can be obtained through GitHub:
remotes::install_github("pachadotdev/spuriouscorrelations")
While the installation process is straightforward, users might want to familiarize themselves with R programming basics. Knowing how to navigate and manipulate data frames can enhance the overall experience. Many in the data science community find that understanding R solidifies their statistical analysis skills, making projects like this one all the more engaging. What’s more, the inclusion of GitHub as a source aligns with modern software development practices, emphasizing community involvement and contribution.
Demonstration of Usage
This package includes a variety of examples, illustrating how seemingly unrelated variables can present correlations that might catch attention and stir curiosity. One notable example compares the number of pool drownings to the number of movies featuring Nicolas Cage. Here’s how this is visualized:
- x: Number of people who drowned by falling into a pool
- y: Films featuring Nicolas Cage
library(spuriouscorrelations)
library(tinyplot)
pool_drownings
year x y
1 1999 109 2
2 2000 102 2
3 2001 102 2
...
11 2009 102 4
cor(pool_drownings$x, pool_drownings$y)
[1] 0.6660043
tinyplot(
y ~ x,
data = pool_drownings,
main = sprintf("Correlation %s", round(cor(pool_drownings$x, pool_drownings$y), 3)),
xlab = "Number of pool drownings",
ylab = "Nicolas Cage films"
)
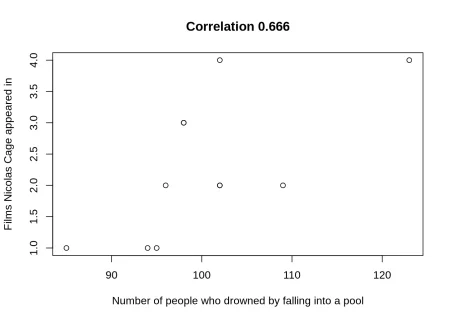
While on the surface this correlation may seem ridiculous—two unconnected variables suggesting a statistical relationship—this actually serves a pedagogical purpose. The juxtaposition invites critical thinking and skepticism about how data can be manipulated to tell misleading stories. In a world overloaded with information, it’s all too easy to misinterpret data without scrutinizing the context.
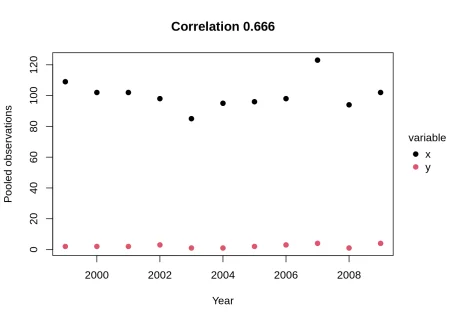
Adjusting the dataset to long format allows for clearer comparisons over the years:
pool_drownings_2 <- reshape(
pool_drownings,
varying = c("x", "y"),
v.names = "value",
timevar = "variable",
times = c("x", "y"),
direction = "long"
)
...
tinyplot(
value ~ year | variable,
data = pool_drownings_2,
main = sprintf("Correlation %s", round(cor(pool_drownings$x, pool_drownings$y), 3)),
xlab = "Year",
ylab = "Pooled observations",
pch = 19
)
Standardizing Variables for Clarity
To enhance visibility and facilitate better comparison, it's beneficial to standardize the variables:
pool_drownings_3 <- pool_drownings
pool_drownings_3$x <- (pool_drownings_3$x - mean(pool_drownings_3$x)) / sd(pool_drownings_3$x)
pool_drownings_3$y <- (pool_drownings_3$y - mean(pool_drownings_3$y)) / sd(pool_drownings_3$y)
pool_drownings_3 <- reshape(
pool_drownings_3,
varying = c("x", "y"),
v.names = "value",
timevar = "variable",
times = c("x", "y"),
direction = "long"
)
...
tinyplot(
value ~ year | variable,
data = pool_drownings_3,
main = sprintf("Correlation %s", round(cor(pool_drownings$x, pool_drownings$y), 3)),
xlab = "Year",
ylab = "Standardized observations",
pch = 19,
type = "b"
)
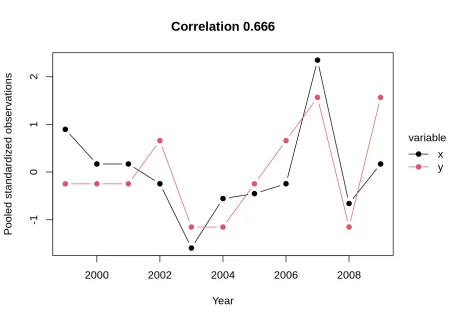
Standardization not only makes the comparisons clearer, but it also allows for a nuanced understanding of the data’s characteristics. Readers might find that some correlations appear stronger or weaker when considering the standardized values. Adjusting for different scales is a common practice in data analysis, and this example encapsulates its necessity in drawing accurate conclusions.
The Broader Implications of Spurious Correlations
This exploration of spurious correlations reflects a larger issue within data interpretation practices. If you're working in this space, take heed: data misinterpretation can lead to misguided decisions across fields, from business to public health. What this means for you is simple. Being constantly attuned to the context behind data is vital. The danger isn't just misunderstanding a single study but rather propagating misinformation that can lead others astray.
The light-hearted nature of such correlations serves a dual purpose; it entertains while simultaneously educating audiences about the critical importance of rigor in data analysis. Educators and practitioners alike can harness these correlations for workshops or talks focused on statistical literacy. As data continues to play an increasingly integral role in decision-making across sectors, initiatives that promote skepticism—like the Spurious Correlations package—offer essential commentary on the statistical processes that guide our lives.
The Spurious Correlations project embodies more than just a dataset; it’s a reminder of the need for vigilance when encountering data claims. Its ongoing success hinges not only on technological updates but also on community engagement and education, as developers continue to highlight how context influences interpretation. In an environment rife with statistical claims, this project stands as both a beacon of humor and a serious call for critical engagement. And this is the part most people overlook: the necessity of questioning data, especially when it’s presented as fact.
R-bloggers.com offers daily email updates about R news and tutorials about learning R and many other topics. Click here if you're looking to post or find an R/data-science job.
Want to share your content on R-bloggers? click here if you have a blog, or here if you don't.