Evaluating the Accuracy of Geographical Signpost Distances with R
Introduction to Evaluating Signpost Distances
Colorful signposts indicating the distance to major cities are commonplace in tourist hotspots, but how accurate are these representations of distance? It’s a simple yet intriguing question worth exploring, especially when one finds themselves on vacation, gazing at a signpost that might not reflect their true location. These signposts, while often seen as a friendly guide to travelers, may sometimes mislead those who rely on them. In this analysis, we'll examine how to assess the honesty of geographical signposts using the R programming language and geolocation data.
Creating a Function to Geocode Cities
To start, we need a function that retrieves the geolocation (latitude and longitude) of the cities listed on our signposts. Using the OpenStreetMap API simplifies this process considerably. This geocoding step is pivotal; without accurate coordinates, any subsequent analysis will be flawed from the outset. Once we gather these geolocation metrics, we can begin scrutinizing the distances claimed by the signposts.
geocode_city <- function(city_name) {
  url <- modify_url(
    "https://nominatim.openstreetmap.org/search",
    query = list(
      q = city_name,
      format = "json",
      limit = 1
    )
  )
  resp <- tryCatch(
    GET(url, user_agent("PointingSignFinder/1.0 (R script)")),
    error = function(e) {
      cat(" Error on endpoint")
      return(NULL)
    }
  )
  if (is.null(resp) || http_error(resp)) {
    cat(" Error on http\n")
    return(NULL)
  }
  result <- fromJSON(content(resp, as = "text", encoding = "UTF-8"))
  if (length(result) == 0) {
    cat("Error on result")
    return(NULL)
  }
  lat <- as.numeric(result$lat[1])
  lon <- as.numeric(result$lon[1])
  cat(sprintf(" found: %.4f°, %.4f°\n", lat, lon))
  Sys.sleep(1.1)
  list(lat = lat, lon = lon, display_name = result$display_name[1])
}
This function not only retrieves the city's coordinates but does so with consideration for potential errors in the API call. Error handling ensures that if a city isn't found or if there's a network issue, the function gracefully returns NULL rather than crashing, which keeps your analysis on track.
Locating the Honest Signpost
The next stage involves developing a function that employs the geolocation data alongside the distances provided by the signposts. This function will calculate potential intersections of all points based on the specified distances, creating a bounding box to efficiently search for the intersection point. The methodology here isn't merely straightforward; it highlights how geographic discrepancies can surface, often challenging the accuracy of a signpost. The premise is simple: the distance displayed shouldn't stray far from actual measurements. But is that the case?
sign_location_finder <- function(cities, distances, tolerance = 50) {
  stopifnot(length(cities) == length(distances))
  stopifnot(length(cities) >= 2)
  cat("Step 1: Geocoding cities\n")
  coords <- lapply(cities, geocode_city)
  failed <- which(sapply(coords, is.null))
  if (length(failed) > 0) {
    stop(sprintf("Location not found: %s", paste(cities[failed], collapse = ", ")))
  }
  sign_data <- data.frame(
    city = cities,
    lat = sapply(coords, `[[`, "lat"),
    lon = sapply(coords, `[[`, "lon"),
    dist_km = distances
  )
  #... Remaining code to calculate points of intersection ...
}
This function checks for the closest intersection point by calculating the distance between signpost distances and actual geolocations. What this means for you is that you'll begin to visualize discrepancies and gauge their importance in practical scenarios.
Testing the Function with a Realistic Example
To validate our findings, let’s utilize actual distances between the capital city of Slovenia, Ljubljana, and several neighboring cities. An air distance calculator can provide the necessary figures to input into our function. Here's how you would run it:
result <- sign_location_finder(
  cities = c("Koper", "Celje", "Maribor", "Kranj"),
  distances = c(83, 61, 104, 24),
  tolerance = 20
)
We provided realistic air distances from Ljubljana to its surrounding cities, establishing a practical frame of reference. Once the calculation is executed correctly, it should reveal that the closest intersection aligns with Ljubljana, reaffirming or challenging the signpost's claims. If you’re grappling with similar projects, this is the sort of validation process you’ll want to implement.
Visualizing the Results
Now that we’ve executed our function, it’s time to visualize where these intersecting circles meet. By plotting the geolocations and their corresponding distances, you can see the convergence points that suggest the actual locations of these signpost markers. This visualization serves multiple purposes: it validates your results and enriches your understanding of geographic accuracy—or the lack of it—and it offers an engaging visual for any audience captivated by data.
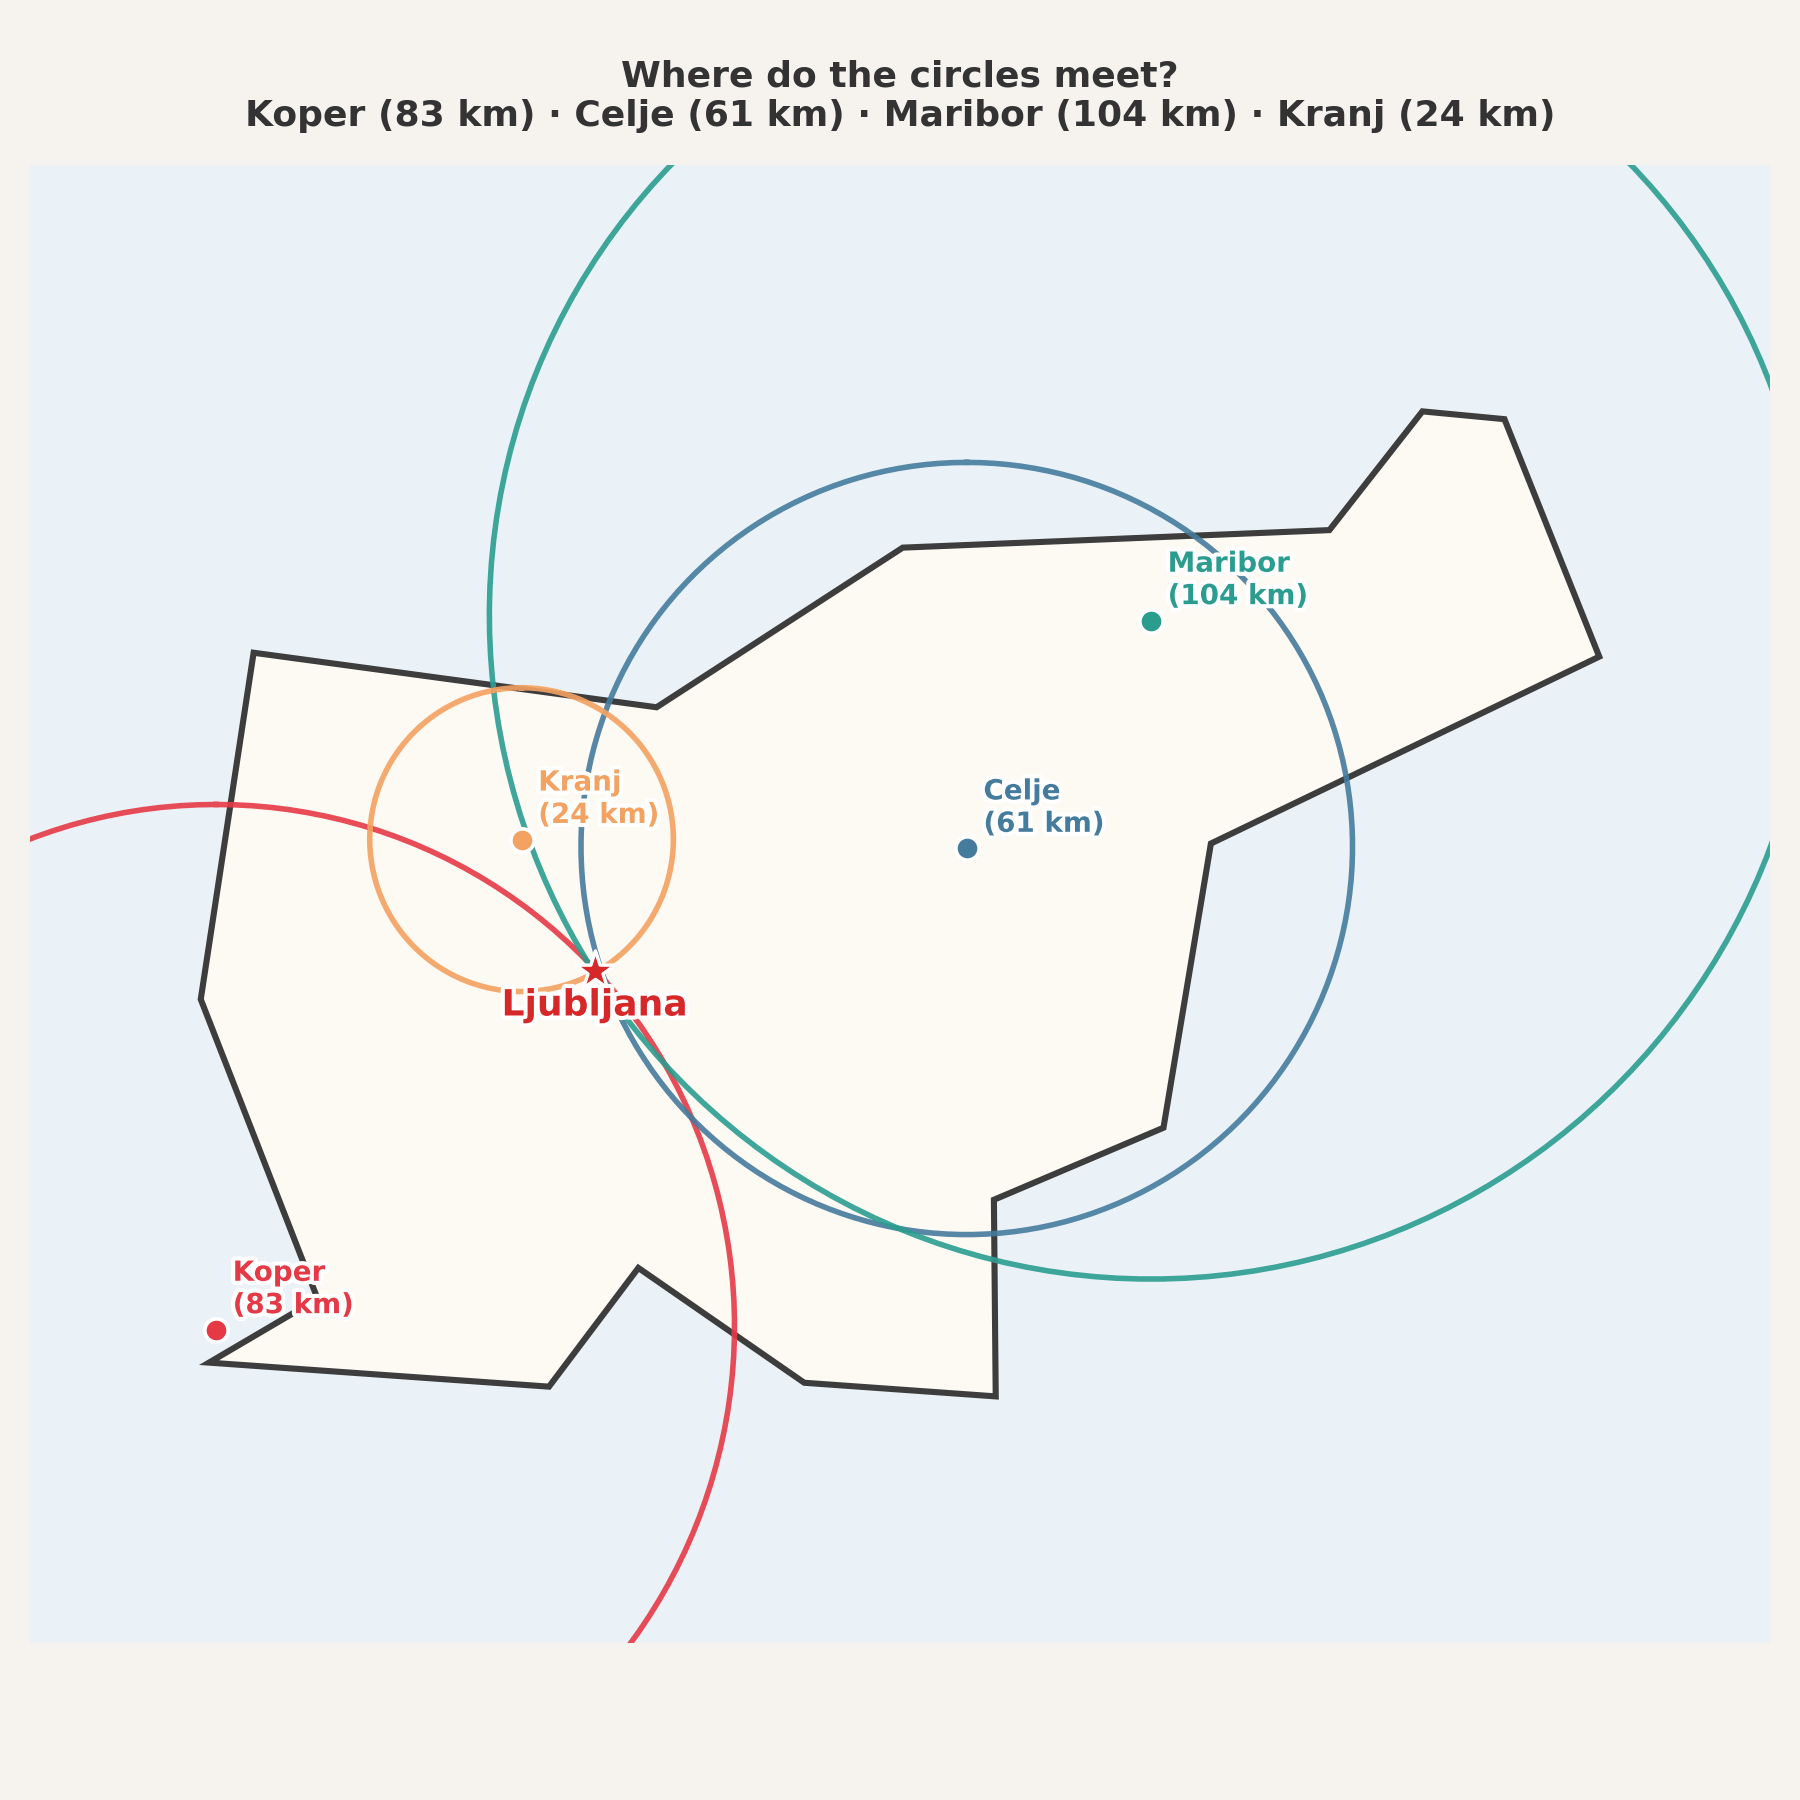
This image not only encapsulates your findings but also provides an intuitive grasp of the data. If you're working in this space, you'll quickly see how geographic data visualization can enhance communication of analytical results.
Implications of Accurate Geolocation
Understanding the shortcomings of signpost distances isn't just a technical exercise; it has broader implications. For tourists, the inaccuracies can lead to misjudgments in travel plans and itineraries. For cities and municipalities, ensuring that signposts reflect true distances can influence tourism, local business, and even public perceptions about the city’s reliability as a tourist destination. The skepticism over signage accuracy can breed mistrust—not an easy hurdle for cities working to attract visitors.
And yet, as technology advances, so too should our expectations. Improved algorithms and APIs can provide more accurate data, and incorporating user feedback directly into signposting systems could keep travelers better informed. Who's to say how many vacation mishaps could be avoided with a more conscientious approach to geographical signage?
Conclusion and Code Access
This exercise not only showcases a practical application of R in geospatial analysis but also acts as an engaging challenge while on your travels. For those interested in accessing the complete code, it’s available on GitHub in the Useless_R_functions repository. The specific code file can be found here.
So the next time you enjoy a trip and encounter a signpost, don't hesitate to validate its claims. You might just be surprised by the accuracy—or lack thereof—of your geographical signpost!
Until then, keep exploring and happy coding!